
As an aspiring data analyst, I’m applying to many entry-level data analytics roles at large companies like Lockheed Martin or Progressive Insurance. I was interested in the Fortune 500 companies dataset because I wanted to see what companies and industries have experienced the most growth and stability over the last decade, where their headquarters are located, and what companies are the most progressive.
I downloaded the data from the years 1996-2023
Primary Source Data: https://www.kaggle.com/datasets/rm1000/fortune-500-companies/data
Github Repository: https://github.com/PabloTheZenCoder/Fortune-500-Excel-Project
Cleaning the data:
The data was fairly clean initially, but there were a few problems. The “delete duplicates” function found zero duplicates. However, when I started working with the data I noticed that many companies had multiple variations of their names. For instance, “Walmart” and “Walmart, Inc”. So these instances were not duplicates per se but they did cause some problems in visualizing the data later on. Thus I decided to manually go through them by filtering the “company name” column and simply scrolling through till I found multiple names for a company. Then manually I would adjust the names to be uniform across the dataset. This was a bit tedious but I couldn’t think of a more efficient way to do it in Excel. Plus it allowed me to learn more about the various companies in the Fortune 500 and their many off-shoots. Some companies like Coca-Cola have European off-shoots( A.k.a Coca-Cola European Partners). I had to dig on the internet to determine that Coca-Cola European Partners is a separate company on the Fortune 500 list. Generally, most of the instances were straightforward like “Adobe” and “Adobe Systems” being the same company.

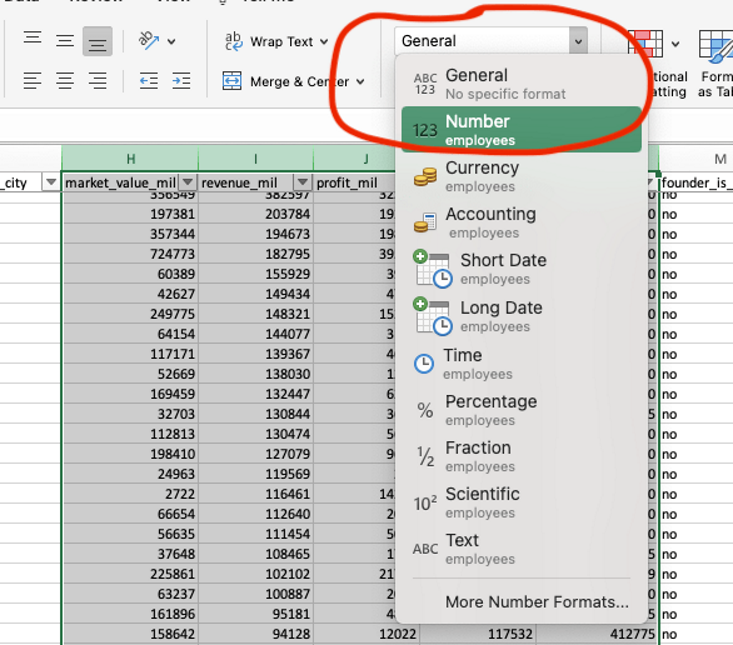
Now, with the company names all standardized throughout the dataset, the only other problem I noticed was that some of my numeric data had varied datatypes. For instance, the “employees” column included cells that were in scientific notation for some reason.
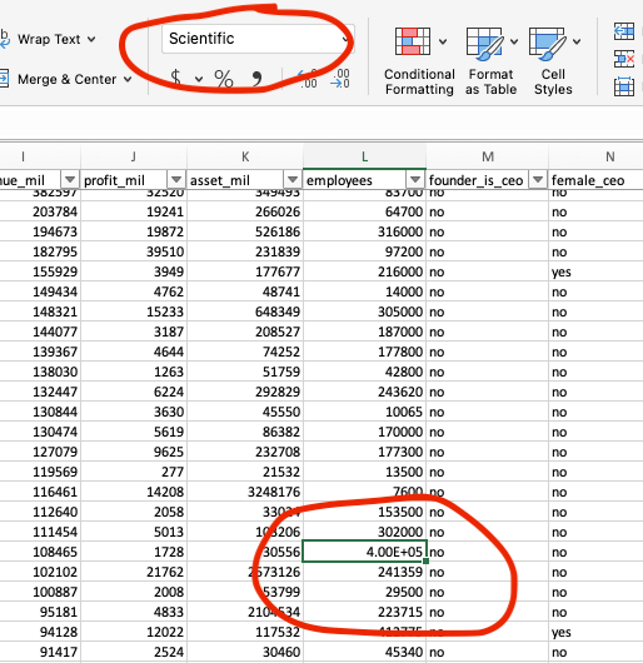
This was simple enough to fix as I only needed to convert and standardize all of my numeric columns from a “General” or “Scientific” datatype to the “Number” datatype. Overall this is a good change because it allows easier manipulation if I ever bring the data over to SQL or Python to further analyze.
Data Exploration
Now that the dataset is clean, we can move on to analyzing and exploring the dataset for key findings.
Goals:
Primary Goal: To analyze the Fortune 500 dataset from a “job-searching” perspective looking at the top industries and companies from the last decade.
Secondary Goal: Quickly extract key insights from this dataset and communicate them clearly through a visualized dashboard.
Third Goal: Showcase primary and basic functions of Microsoft Excel including XLOOKUP, FILTER,SUMIF, COUNTIF, Pivot tables, charts, and conditional formatting.
Fourth Goal: Publish a storyboard portfolio project on my personal blog.
Questions to Ask:
- What are the top industries and companies located close to me, i.e. in the southeast?
- What are the top companies/industries with female CEOs?

3. What industries have seen the most consistent growth over the last 9 years?
Pivot Chart
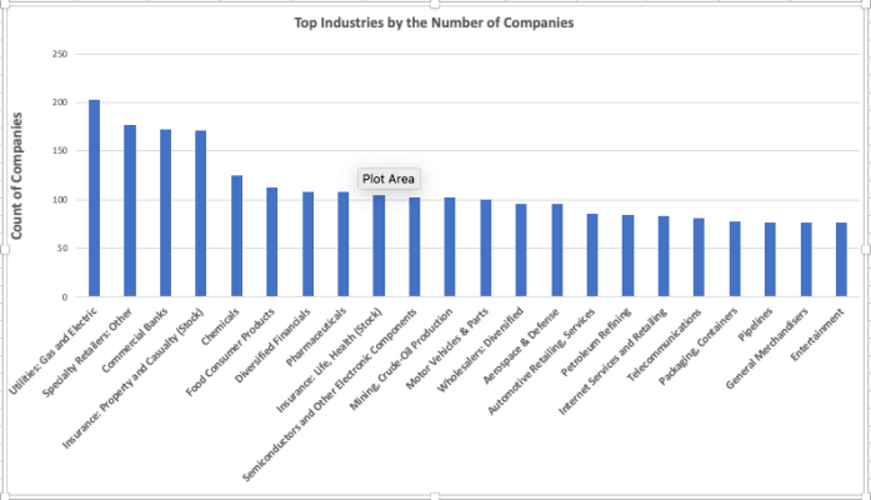
From this first pivot chart, we can see that the industries with the highest number of companies in the Fortune 500 list are:
- Utilities: Gas and Electric
- Specialty Retailers: Other
- Commercial Banks
- Insurance: Property and Casualty
- Chemicals
Creating Pivot Chart 2
For the second pivot table, I wanted to split up my pivot table by region which required me to create my own column “Region”. To do this I had to create a separate tab on a separate sheet listing all U.S. states and their corresponding regions.
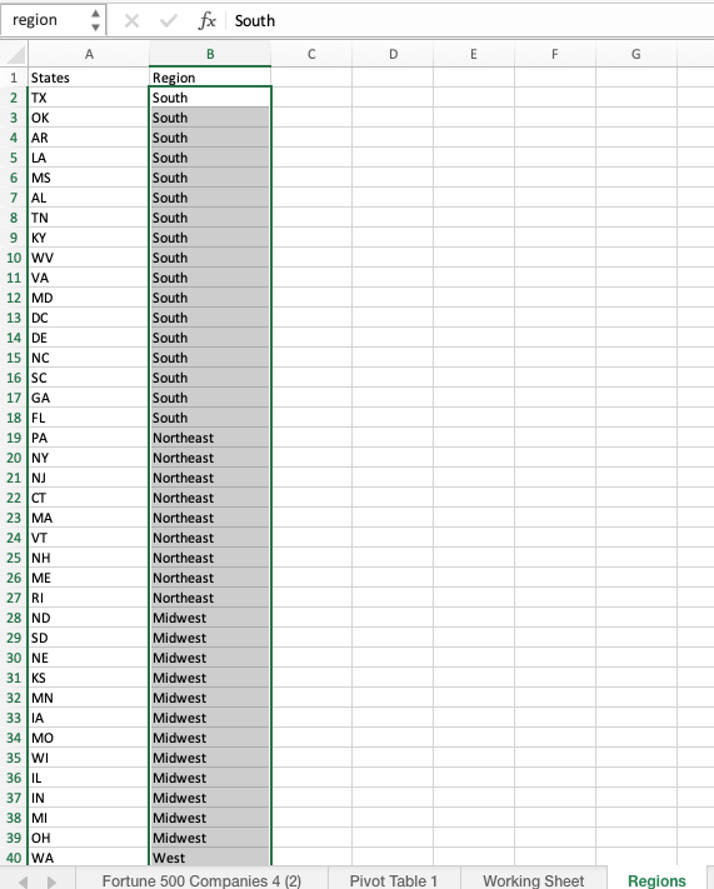
Now I could use the XLOOKUP function to connect each Headquarters_state column to the corresponding region.

With the “Regions” column added and filtering for Women_Ceo = Yes, pivot chart 2 has much more specialized data.
With some simple pivot charts, I could begin to answer a few of my questions.
The industries with the highest number of Fortune 500 companies are:
- Utilities: Gas and Electric
- Specialty Retailers: Other
- Commercial Banks
- Insurance: Property and Casualty
- Chemicals
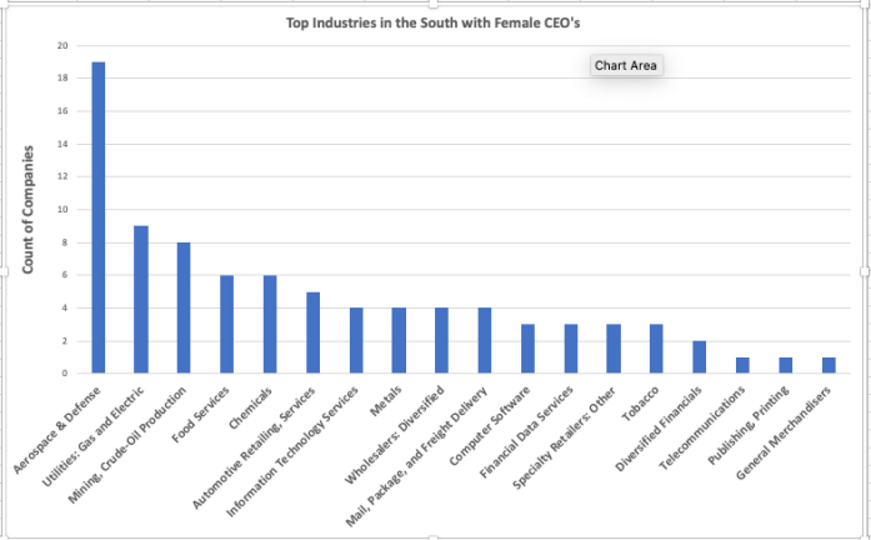
And secondly, the top industries located in the South, AND with a female Ceo are:
- Aerospace and Defense
- Utilities: Gas and Electric
- Mining, crude oil Production
- Food Services
- Chemicals
- Automotive Retailing, Services
What companies and industries ranked in the top 5 according to revenue for 2015-2023?
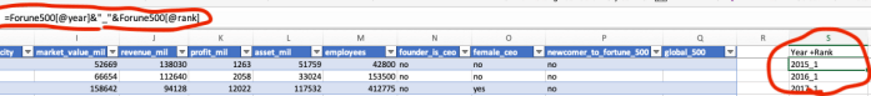
In order to figure this out, once again, I created my own column “Year + Rank” which used a formula to connect the already included “Year” and “Rank” columns.
Then I used a really cool new function I learned recently called “UNIQUE” which pulls all the unique values from a column, so applied to the “Year” it allowed me to quickly list all my years without having to type each one individually.
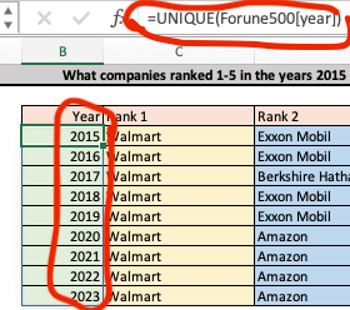
Then I used the XLOOKUP function to connect my Year+Rank column to a corresponding company and industry.

So to recap a bit the companies consistently ranked in the top 5 Fortune 500 list are:
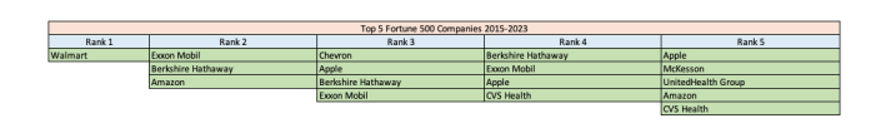
Correspondingly, the industries consistently ranked in the top 5 Fortune 500 list are:
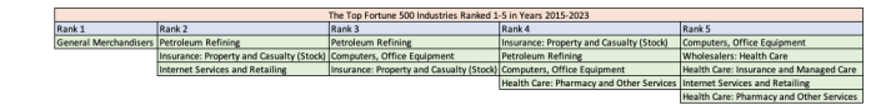
From these simple visualizations, I can focus my data analyst job search on specific companies and industries. For instance:
- General Merchandisers, Walmart
- Insurance Companies, Berkshire Hathaway
- Computers and Tech, Apple and Amazon
- Health Care, CVS Health, and United Health Group
Exploring Female_CEO data
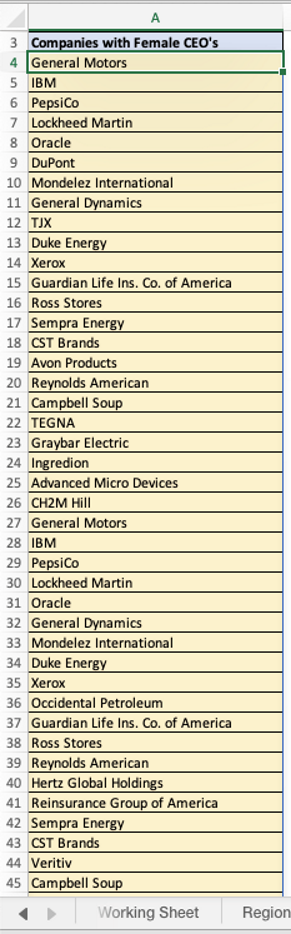
What are all the companies that have had women CEOs throughout the years 2015-2023?
I used the FILTER function to filter out just the companies that had the column [[female_ceo]]=”yes” thus getting the list:
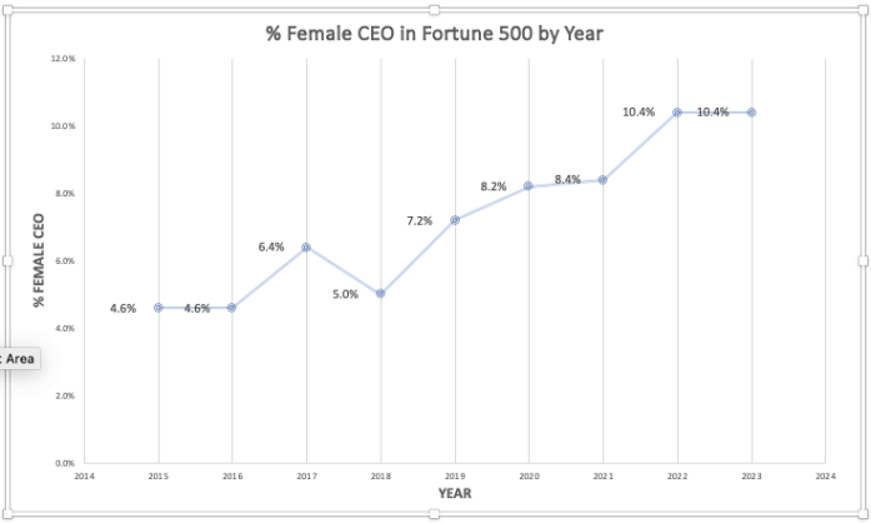
Similarly, what percentage of the companies in the Fortune 500 from 2015-2023 are women CEOs?
Using the COUNTA function I was able to count the number of companies per year that had a Female CEO and divide that number by 500(i.e. the number of companies included in the Fortune 500 every year).
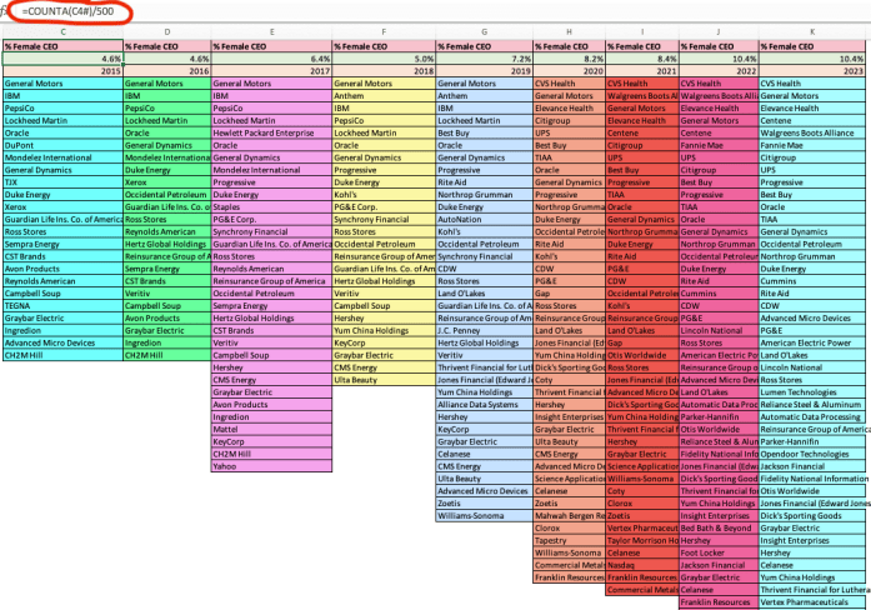
So while the percentage of Female CEOs in the Fortune 500 is still relatively small compared to the percentage of male CEOs, that percentage is growing every year. Woo! Power to the Women, No Delay!
Industry Growth and Stability
Finally, to tie it all together I wanted to see what industries have consistently grown over the last 9 years. I decided to include only the top industries that have consistently come up during the course of this project. I also excluded industries that I just wasn’t interested in or didn’t see many opportunities for data analysts in.

From this visualization, we can see that “General Merchandisers” like Walmart have the highest revenue, and that revenue has consistently grown. “Insurance”, “Health Care”, and “Computers” have stayed at the top revenue levels and consistently grown. Specialty retailers like Staples or Bed, Bath and Beyond have dipped in the last 8 years and only recently come back to past levels of revenue. This is interesting because the industry that has seen the most growth over the last 9 years is Internet Services and Retailing like Amazon. So companies like Amazon have probably been taking revenue from Specialty Retailers. Aerospace and Defense has seen mostly steady revenue with a bit of a dip in the last couple of years. Computer Software has been relatively low on this revenue scale but has consistently grown. Lastly, Utilities: Gas and Electric has stayed almost completely stagnant.
Conclusion
- The top industries in the South with female CEOs are
- Aerospace and Defense
- Utilities, Gas and Electric
- Mining, Crude Oil Production
- Food Services
- Chemicals
2. The industries with the largest count of companies on the Fortune 500 list are:
- Utilities, Gas and Electric
- Specialty retailers
- Commercial Banks
- Insurance: Property and Casualty
- Chemicals
3. The companies ranked in the top 5 of the Fortune 500 are
- Walmart
- Exxon Mobile
- Berkshire Hathaway
- Amazon
- Chevron
- Apple
- CVS Health
- Mckesson
- UnitedHealth Group
4. Since 2015 the percentage of Female CEOs has increased.
5. The Industries that have consistently grown or remained stable over the last 9 years are
- General Merchandisers
- Insurance
- Healthcare
- Computers
- Internet Services and Retailers
- Aerospace and Defense
- Computer Software
- Utilities: Gas and Electric
From this analysis, I can see trends in the companies that keep reoccurring allowing me to better aim my data analyst job search. Having spent countless hours on various job boards, I now know that the industries I’ll be keeping an eye out for will be general merchandisers, insurance, healthcare, computers and software, utilities, internet services and retailers, aerospace and defense, and specialty retailers. I also have a better idea of what companies have been performing well and hiring more progressively over the last nine years.