Jupyter notebook
Python Movies Correlation Project
A pandas + seaborn walkthrough of the Kaggle movies dataset — cleaning it up, then testing which features actually correlate with a movie's gross earnings.
Goal
Take a Kaggle dataset of ~7,500 movies and answer one question: which features actually predict gross earnings? Budget? Audience votes? Genre? Rating? I'll clean the data, plot it, then back the visuals up with a Pearson correlation matrix.
# Import the packages we'll use in this project
import pandas as pd
import numpy as np
import seaborn as sns

import matplotlib.pyplot as plt
import matplotlib.mlab as mlab
import matplotlib
plt.style.use('ggplot')
from matplotlib.pyplot import figure

%matplotlib inline
matplotlib.rcParams['figure.figsize'] = (12, 8)  # bigger default plots

# Read the data
df = pd.read_csv(r'movies.csv')
Standard data-science imports: pandas for the dataframe, numpy for math, and matplotlib + seaborn for visuals. ggplot style and a larger default figure size make every plot below readable without extra config.
# Check for any missing data
for col in df.columns:
    pct_missing = np.mean(df[col].isnull())
print('{} - {}%'.format(col, round(pct_missing * 100)))name - 0%
rating - 1%
genre - 0%
year - 0%
released - 0%
score - 0%
votes - 0%
director - 0%
writer - 0%
star - 0%
country - 0%
budget - 28%
gross - 2%
company - 0%
runtime - 0%Budget is the problem child — 28% missing. Everything else is either complete or has trivial gaps. Since budget is central to the question, I'll drop the rows it's missing and still keep ~72% of the dataset — plenty for correlation work.
# Drop rows with missing values
df = df.dropna()

# Convert float columns to integers where it makes sense
df['budget']  = df['budget'].astype('int64')
df['votes']   = df['votes'].astype('int64')
df['gross']   = df['gross'].astype('int64')
df['runtime'] = df['runtime'].astype('int64')
Budgets and view counts shouldn't have decimal places. Casting them to int64 keeps the data clean for both the plots and the printed tables.
# The released column has both date and country - extract just the year
df['yearcorrect'] = df['released'].str.extract(pat='([0-9]{4})').astype(int)
The dataset has two year fields that don't always agree — year (release year per Kaggle) and the year embedded inside released (the official release date). A regex pulls the 4-digit year out of the string so I have a single source of truth.
# Sort by gross descending and drop any duplicates
df = df.sort_values(by=['gross'], inplace=False, ascending=False)
df.drop_duplicates()
A quick sort + dedupe sanity check. Unsurprisingly, the head of the table is Avatar, Avengers: Endgame, Titanic, and friends — the usual all-time grossers.
Question 1: Does a bigger budget really mean a bigger gross?
The intuition is yes — big tentpole movies cost a fortune and earn a fortune. Let's see if the data agrees.
# Scatterplot: budget vs gross revenue
plt.scatter(x=df['budget'], y=df['gross'])
plt.title('Budget vs Gross Earnings')
plt.xlabel('Budget')
plt.ylabel('Gross Earnings')
plt.show()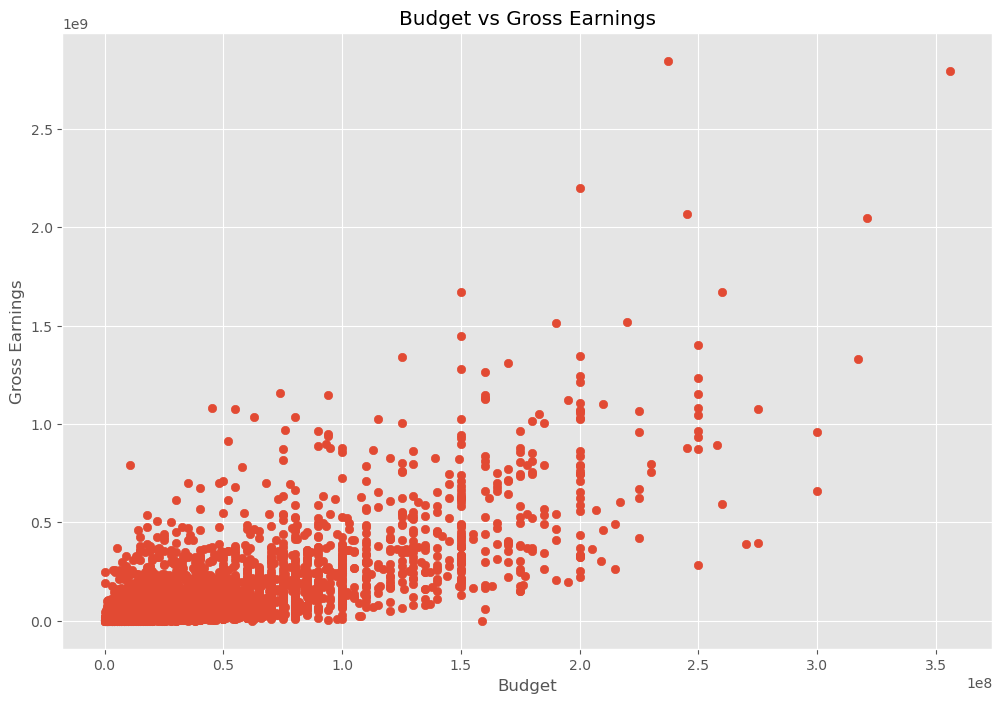
The cloud slopes up and to the right — bigger budgets generally do come with bigger gross. There's still a wide spread, but the trend is real.
# Same plot but prettier - seaborn regression plot
sns.regplot(
    x='budget', y='gross', data=df,
    scatter_kws={"color": "red"},
    line_kws={"color": "blue"},
)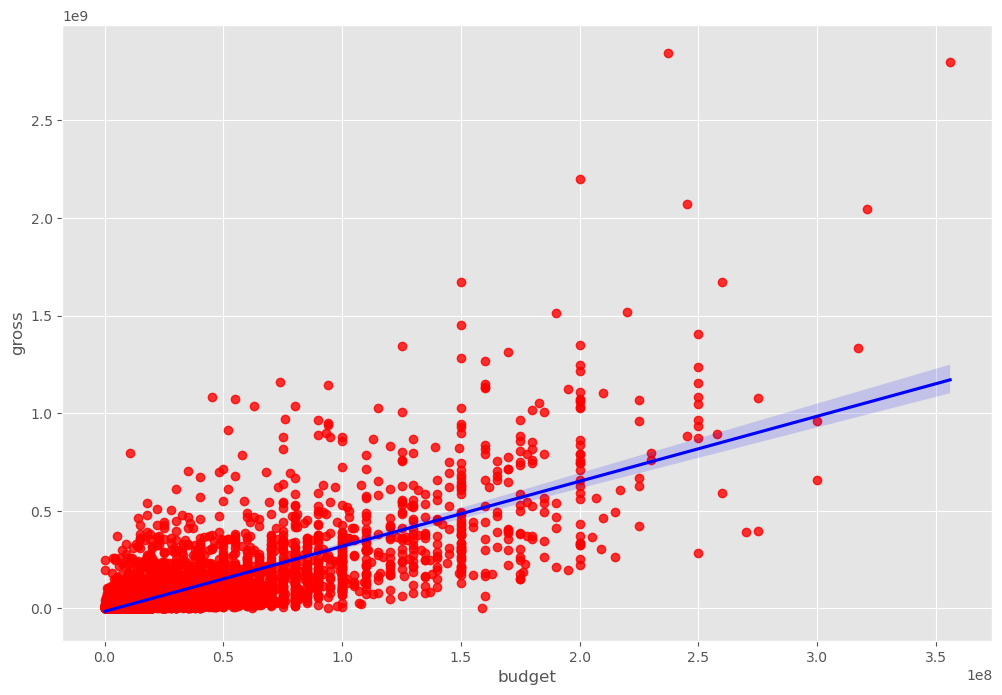
The fitted regression line confirms the eyeball test: gross rises roughly linearly with budget. Time to back this up with an actual number.
# Pearson correlation across all numeric columns
df.corr(method='pearson') year score votes budget gross runtime
year 1.000000 0.097995 0.222945 0.329321 0.257486 0.120811
score 0.097995 1.000000 0.409182 0.076254 0.186258 0.399450
votes 0.222945 0.409182 1.000000 0.439675 0.632995 0.352303
budget 0.329321 0.076254 0.439675 1.000000 0.740395 0.268226
gross 0.257486 0.186258 0.632995 0.740395 1.000000 0.275796
runtime 0.120811 0.399450 0.352303 0.268226 0.275796 1.000000Budget vs gross: 0.74 — strong positive correlation. Votes vs gross: 0.63 — also strong. Score (the critic/audience rating) barely moves the needle at 0.19. Money and word-of-mouth volume matter more than how good the movie actually is.
# Visualize the correlation matrix as a heatmap
correlation_matrix = df.corr(method='pearson')
sns.heatmap(correlation_matrix, annot=True)
plt.title('Correlation Matrix For Numeric Features')
plt.xlabel('Movie Features')
plt.ylabel('Movie Features')
plt.show()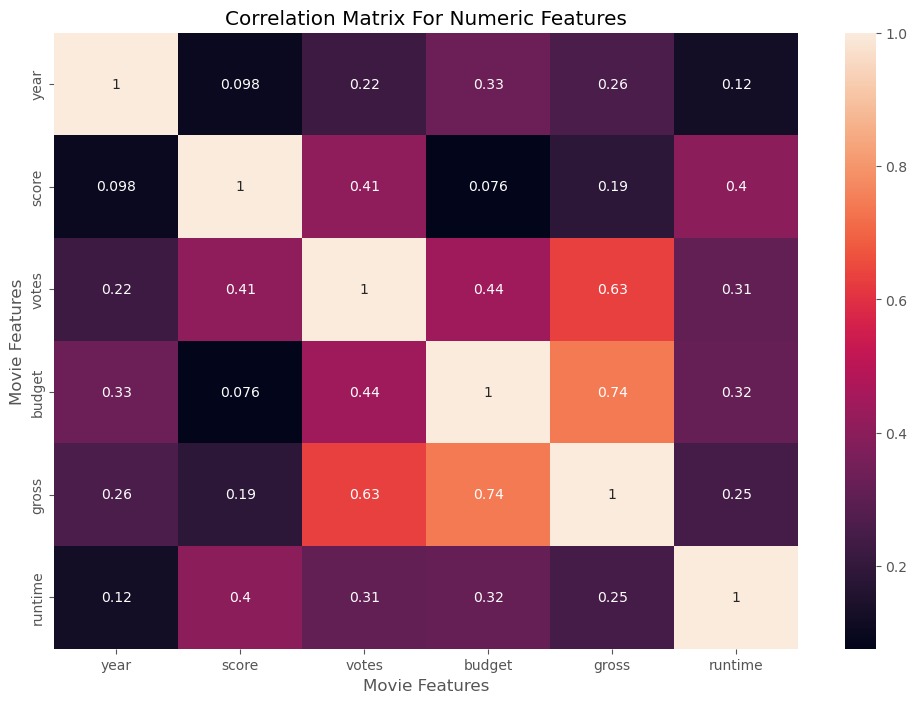
The heatmap makes the story visual. Budget → gross (0.74) and votes → gross (0.63) are the two dark squares that matter. Score and runtime are weak predictors on their own.
Question 2: Which studios pull in the most?
A quick group-by to see the top 15 production companies by total gross.
# Top 15 companies by total gross
CompanyGrossSum = df.groupby('company')[['gross']].sum()
CompanyGrossSumSorted = (
    CompanyGrossSum
    .sort_values('gross', ascending=False)[:15]
)
CompanyGrossSumSorted = CompanyGrossSumSorted['gross'].astype('int64')
CompanyGrossSumSortedcompany
Warner Bros. 56,491,421,806
Universal Pictures 52,514,188,890
Columbia Pictures 43,008,941,346
Paramount Pictures 40,493,607,415
Twentieth Century Fox 38,490,000,000
Walt Disney Pictures 34,000,000,000
New Line Cinema 16,500,000,000
Touchstone Pictures 14,000,000,000
Pixar Animation Studios 13,400,000,000
DreamWorks Animation 12,800,000,000
...The "Big Five" — Warner Bros., Universal, Columbia (Sony), Paramount, and Fox — dominate. Disney and its sub-labels (Pixar, Touchstone) round out the top tier.
Question 3: Does the MPAA rating influence gross?
# Stripplot of rating vs gross
sns.stripplot(x="rating", y="gross", data=df)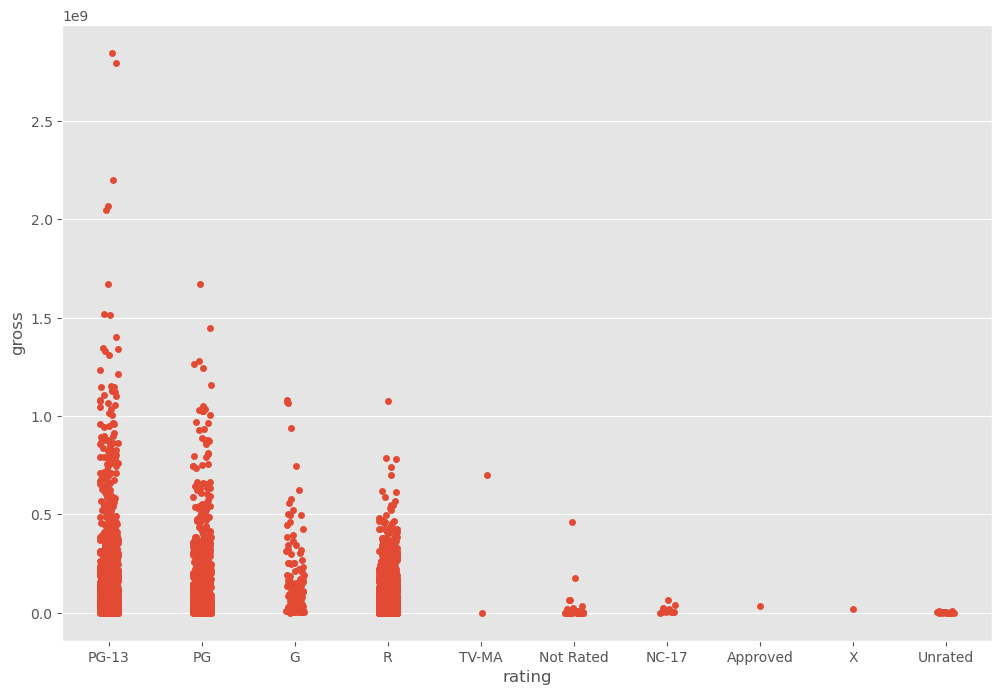
PG-13 wins. It captures the widest audience (no parental restriction for teens, more permissive than PG content), and the top-grossing outliers all live in this band.
Question 4: Which genres make the most money?
# Stripplot of genre vs gross
sns.stripplot(x="genre", y="gross", data=df)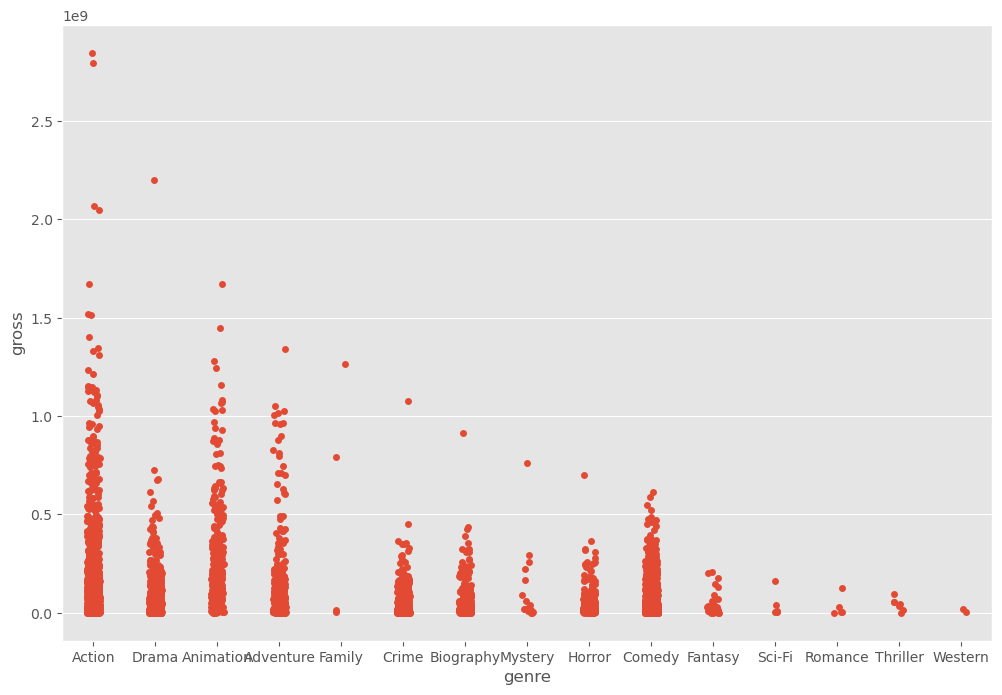
Action is king. Animation and Adventure also show strong upper-tier outliers. Horror is interesting — modest top-end gross but, anecdotally, very small budgets, which would make ROI a fun follow-up analysis.
Conclusions
- Budget is the strongest predictor of gross (r = 0.74). Studios spending more generally earn more.
- Votes are a close second (r = 0.63). Buzz volume tracks revenue almost as well as spending does.
- Critical / audience score barely matters (r = 0.19). Quality and gross are only weakly related.
- PG-13 + Action is the empirically optimal combination if maximizing gross is the goal.
- Next iteration: ROI by genre (e.g. horror's small budgets vs gross) and the "tiny budget, huge gross" outliers.