Case study
Fortune 500 Excel Analysis
An Excel portfolio project analyzing Fortune 500 data from 2015–2023 — viewing the dataset through a job-search lens to find the industries, companies, and trends worth paying attention to.
01 — Questions
The questions I wanted to answer
- What industries and companies have female CEOs and are located in the South?
- What companies and industries ranked in the top 5 by revenue for 2015–2023?
- What industries and companies have seen the most consistent growth over the last 9 years?
02 — Approach
Approach & analysis
Source data: Fortune 500 Companies (Kaggle), covering 1996–2023. I formatted, compiled, and cleaned the data into a single workbook and used core Excel features — XLOOKUP, FILTER, SUMIF, COUNTIF, pivot tables, charts, and conditional formatting — to extract insights.
- Primary goal: analyze the Fortune 500 from a job-searching perspective.
- Secondary goal: quickly extract key insights and communicate them via a visualized dashboard.
- Third goal: publish a storyboard portfolio project on my personal blog.
03 — Toolkit
Excel tools I used
XLOOKUP / FILTER
Lookups and dynamic filtered ranges
SUMIF / COUNTIF
Conditional aggregation across years
Pivot Tables
Industry × region × year breakdowns
Conditional Formatting
Heatmaps for trend stability
Charts & Dashboards
Visual storytelling for the deck
Data Cleaning
Unifying company name variants
04 — Challenges
Technical challenges
- Excel's "Remove Duplicates" found zero matches, but many companies had multiple name variants (e.g. "Walmart" vs. "Walmart, Inc."). I manually normalized names across the dataset so charts grouped correctly.
- Female_CEO data didn't start until 2015, so analyses involving CEOs were scoped to 2015–2023.
- To visualize regional data, I built a separate U.S. state → region lookup table so I could filter for companies headquartered in the South.
05 — Q1
Top industries in the South with female CEOs
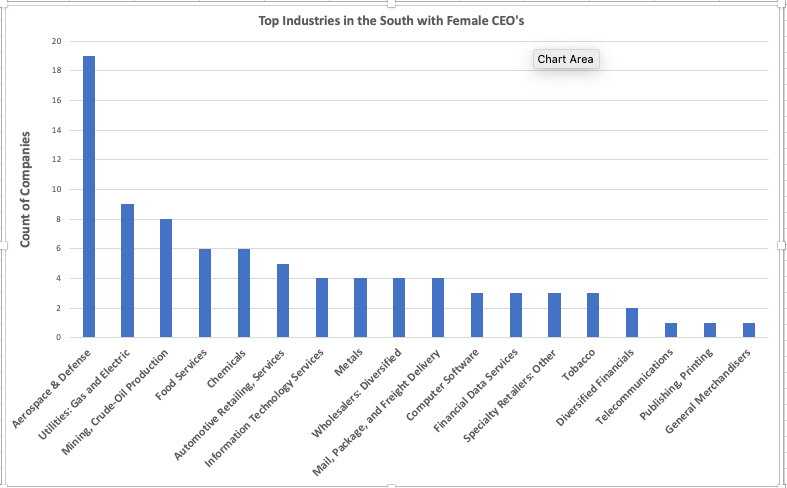
Top 5 industries: Aerospace & Defense, Utilities: Gas and Electric, Mining & Crude-Oil Production, Food Services, and Chemicals.
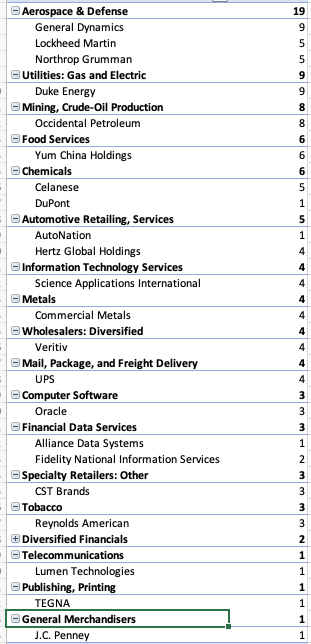
Recognizable names: Lockheed Martin, Duke Energy, Hertz, Oracle, J.C. Penney.
06 — Q2
Top 5 companies and industries by revenue (2015–2023)


These visualizations let me focus a data analyst job search on specific companies and industries:
- General Merchandisers — Walmart
- Insurance — Berkshire Hathaway
- Computers & Tech — Apple, Amazon
- Health Care — CVS Health, UnitedHealth Group
07 — Side tangent
Exploring female CEO data
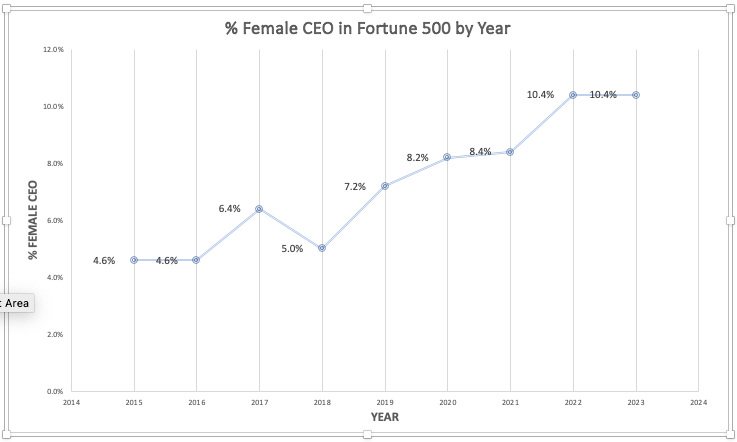
The share of Fortune 500 companies with female CEOs is still small — but it has grown consistently, from 4.6% in 2014 to 10.4% in 2022.
08 — Q3
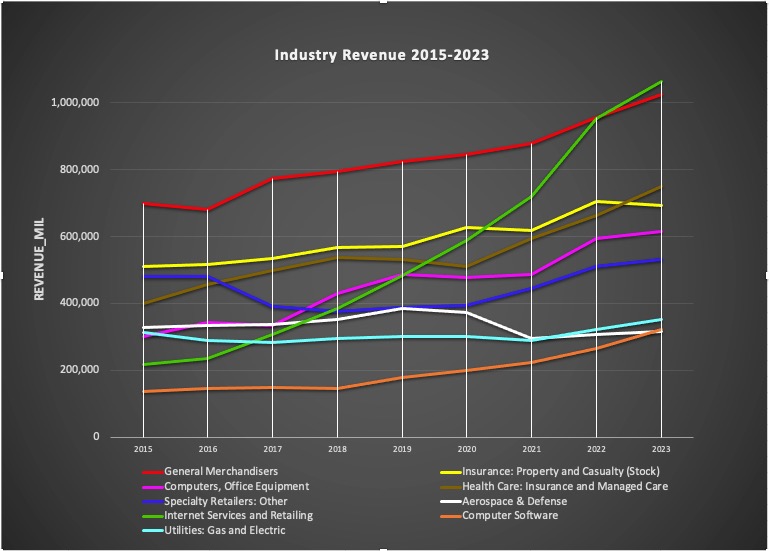
Industry growth & stability (2015–2023)
I scoped this view to industries that kept reappearing across the analysis plus a few I'm personally interested in, then tracked revenue year-over-year.
Sample formula used in the workbook to roll up annual industry revenue:
=SUMIFS(Revenue, Year, 2023, Industry, "General Merchandisers")09 — Conclusions
What I took away
Top industries in the South with female CEOs: Aerospace & Defense, Utilities (Gas/Electric), Mining/Crude Oil, Food Services, and Chemicals.
Industries with the largest count of companies: Utilities, Specialty Retailers, Commercial Banks, Insurance: Property & Casualty, and Chemicals.
Companies ranked in the top 5 (2015–2023): Walmart, Exxon Mobil, Berkshire Hathaway, Amazon, Chevron, Apple, CVS Health, McKesson, and UnitedHealth Group.
Female CEO share is rising: From 4.6% in 2014 to 10.4% in 2022.
Consistently growing or stable industries (2015–2023): General Merchandisers, Insurance, Healthcare, Computers, Internet Services & Retailing, Aerospace & Defense, Computer Software, and Utilities (Gas/Electric).
With these patterns surfaced, I have a much clearer picture of which industries and companies to target in a data analyst job search.
10 — Full deck
Read the full PDF
The complete slide deck — including extra commentary and visuals — lives on GitHub. Preview it below or open it in a new tab.